
Most local investors do not trade full-time. As a result, they often lack the time or resources to fully understand what moves their market. While investing part-time is better than not investing at all, it comes with drawbacks. Without access to quality market data, these investors react more slowly to changes and miss profitable opportunities.
What is market data?
Market data is the information investors use to understand what is happening in financial markets and to decide when to buy, sell, or hold an asset. For many local investors, market data often starts with what they hear around them. This can include news headlines, word of mouth, or even a single tweet that moves sentiment. This type of data is informal and usually fast, but it can also be incomplete or misleading.
As investors gain more experience, market data becomes more structured. In stock markets, this includes share prices, trading volume, company earnings, and sector performance. In forex markets, it focuses on exchange rates, interest rate decisions, inflation figures, and central bank signals.
How can local investors access better market data?
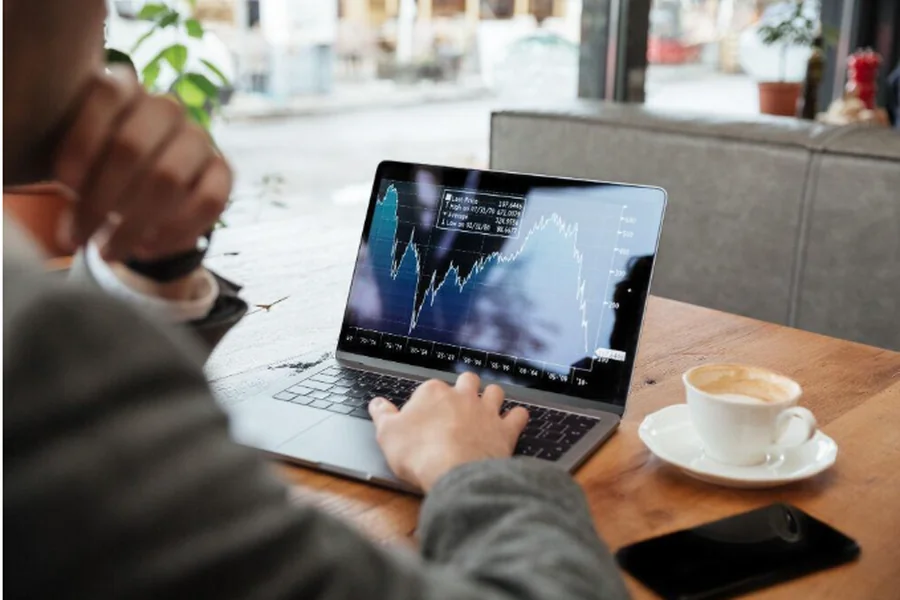
The best market data comes from dedicated platforms built specifically to provide relevant information. These platforms source their data directly from exchanges and continuously update it throughout the day. Many of these platforms require payment to access their best features. This is because maintaining accurate data systems costs money.
TradingView Singapore is a good example of how these platforms work. The free version provides basic features that are often sufficient for local investors. For example, users can only view one chart at a time and can use up to two indicators per chart. They also get access to community ideas and discussions. Traders who want faster reaction and better features will need to pay, depending on their needs. TradingView charges $12.95 per month for the Essential plan when billed annually. This removes advertisements and allows two charts per tab. It also increases indicators to five per chart and adds Volume Profile analysis tools.
Other plans include the Plus plan, which costs $28.29 per month annually and the Premium plan, which costs $59.95 per month annually. These plans offer more features for full time traders. All of these advantages translate into better returns over time. Investors who use quality data consistently outperform those who rely on tips and rumours. They also make fewer mistakes and react faster to changes.
How Quality Market Data Helps Local Investors Make Better Financial Decisions
The endgame of any investor is to make better profits from any of the financial markets and better data can help achieve this in many ways, including:
Faster Decision-Making
The difference between somebody who makes a significant return compared to another investor could simply be how fast they react to changes in the market. Many dedicated platforms now give local investors all the tools they need to make quicker decisions. TradingView, for example, is equipped with alerts that are very versatile. Investors can set alerts for when prices hit a certain level so that they are the first to know.
They can even open positions or close positions directly with stop-loss and take-profit orders. A stop-loss is a preset level where a trade automatically closes to limit how much money you can lose. A take-profit works the same way but in your favor, closing the trade once it reaches your target price. These tools help investors lock in gains and control risk without needing to watch the screen all day. Quality market data helps investors react quickly to price changes, news, and trends instead of acting late based on rumours.
Enables Trend Identification
Trend trading is one of the best strategies in the financial markets. It is based on a simple idea: when prices follow a pattern, they usually continue in that direction. Trends can move upward, downward, or sideways, and recognizing them early gives investors a real edge. With quality market data, local investors can spot these patterns as they form and position themselves early to follow the trend. This means they can ride the movement for as long as it lasts and exit before it reverses.
Better Timing for Entry and Exit
Investors can perform technical analysis to understand support and resistance levels, which help identify their best entry and exit points. Support is a price level where buying interest is strong enough to stop the price from falling further. Resistance is the opposite, a level where selling pressure prevents the price from rising higher. Clear charts and volume data help investors decide when to buy or sell rather than guessing based on emotions.
More Confidence in Decisions
When decisions are backed by data, investors feel more confident and are less likely to panic during volatility. Knowing that a choice was made based on real numbers and solid analysis gives investors the courage to hold their positions when the market gets shaky. This confidence also helps them stay consistent with their strategy over time, which is key to long-term success.
Reduces Emotional Decision-Making
Data provides objective facts instead of relying on fear or greed. It helps investors stick to their strategy during market volatility and removes guesswork from timing decisions. Many investors lose money not because they picked the wrong asset but because they let emotions push them to buy too late or sell too early. Quality market data keeps investors grounded, giving them something solid to base their actions on rather than reacting to panic or hype.
Make Smarter Moves With Better Data
Any kind of investor, especially local investors, can make measurable changes in their decision-making process using better market data. With access to reliable analytics tools, you can operate with better market confidence no matter the ongoing market conditions.
